


Custom Views
Introduction
Custom View is a powerful mechanism introduced in VocBench 11.0.0 that allows you to customize the representation of values into the ResourceView.
A Custom View represents values through different views (or widgets) that are rendered into the Resource View when a so-called triggering property is detected. This means that whenever a resource being described in the ResourceView has an outgoing property for which a Custom View is associated, its value will be showed according such Custom View.
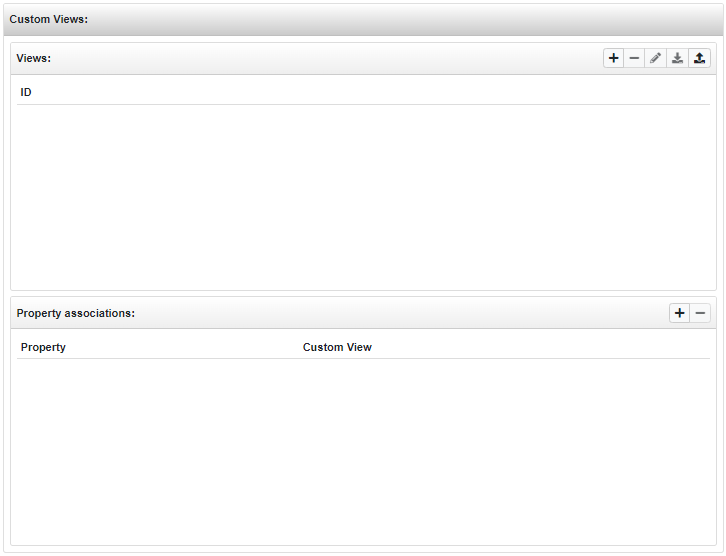
The Custom Views editor is accessible via the Tools > Custom Forms and Views entry under the top navigation bar. Since they can be often used in combo, this tool has been grouped with the Custom Form one under the same page. The Custom View panel is on the right side of the page and it is basically splitted in two sections, the top one which manages the Views, and the bottom one which allows the definition of association between properties and Views.
For simplicity, let's start form the latter.
Property associations editor
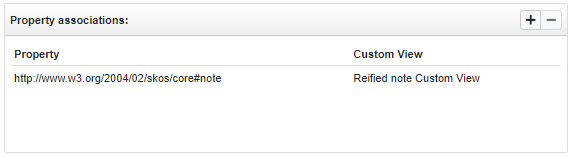
The Property associations panel lists the associations between triggering properties and Custom Views, namely determines which Custom View is expected to be shown when a value for such property is detected in a Resource View.
A new association can be created by clicking on the + button which opens the following dialog which trivially requires the selection of a property (by browsing the property tree) and a Custom View among those available. Whereas multiple widgets are available for the chosen Custom View, it is possible to select the Default view.
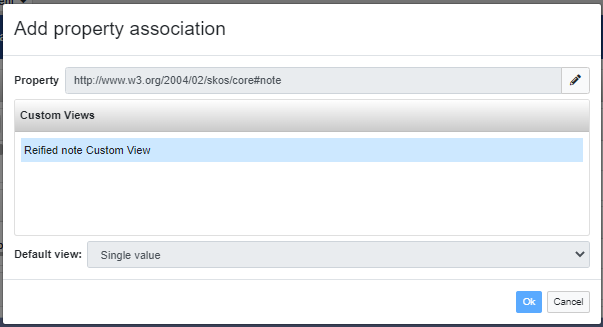
A triggering property can be associated to just one Custom View, but different properties may be associated to the same Custom View.
Views editor
The Views panel lists the Custom Views available in VocBench. On the panel header a toolbar allows actions on them: it is possible to edit, delete, export on the local file-system an existing View, and its also possible to import (from file-system) and create new Views.
By clicking on the + button the following editor is prompted, here you must enter a unique Name and select a Category and a Model.
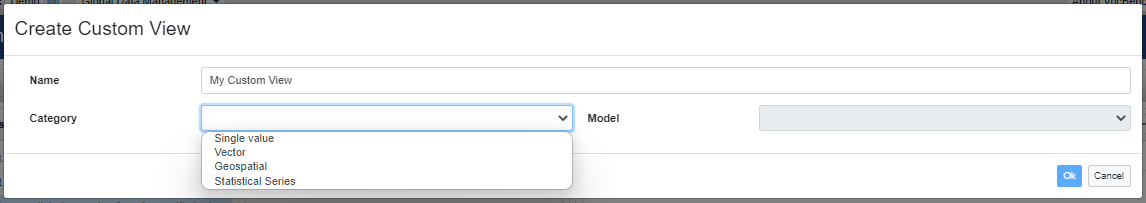
There are four categories of Views, each of which supports multiple models.
-
Single value: views for rendering data through a single value.
- Property chain: the value to render is reached through a chain of properties.
- Advanced single value view: the value to render is selected by means a SPARQL query.
-
Vector: the views of this category show, in place of the property object, a vector of values in tabular form.
- Predefined static vector model: the values that compose the vector are the objects of a property set.
- Dynamic customizable vector model: the values of the vector are retrieved by means a SPARQL query.
-
Geospatial: category for representing geospatial data as:
- Point: a single point represented on a map.
- Area: multiple points which create an area.
- Route: multiple point which describe a route.
-
Statistical series: category for representing statistical data as:
- Series: a series of numerical values.
- Series collection: a collection of series.
When a category is selected, the editor restricts the selection of the model according the schema above, then, when the model is selected too, it prompts the proper editor for such Custom View.
At the bottom of the editor, a Suggested view selector let the user choose which view/widget use for representing the data. We will see the available options in the following sections, anyway, for most of the Custom Views, only a view is available and in such cases the selector is constrained to the only option.
Let's see in details each Custom View.
Single value views
By means of these views, an object in the ResourceView can be rendered with a single value which is the "usual" widget for representing values in the ResourceView. Under this Custom View category two model implementations are available: the property chain and the advanced single value view.
Property chain
This is probably the simplest view available, the rendered single value is reached passing by a property chain.
The editor for this view is quite simple and it is composed only by a Property chain selector which allows the definition of the property chain.
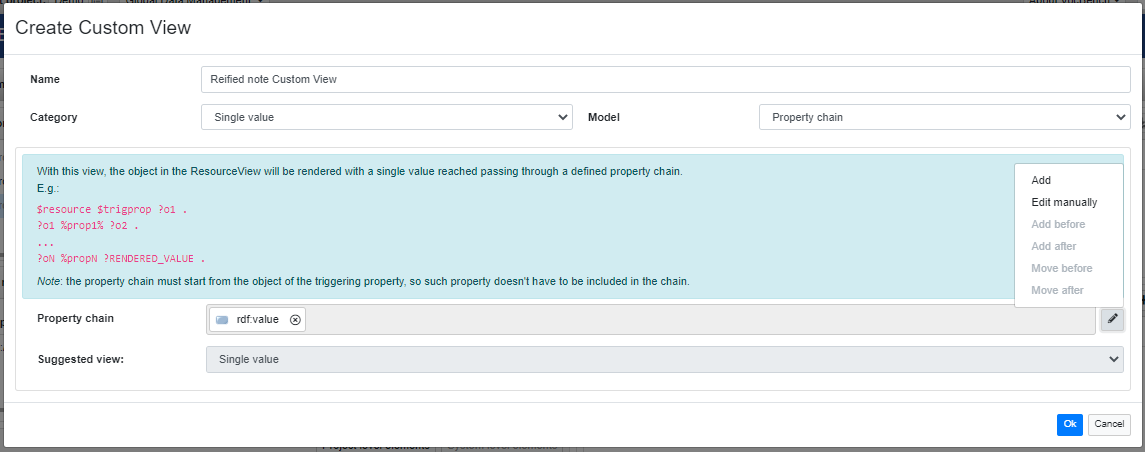
Here below you can see an example of usage of this view for a reified note use case. The Custom View defined in the previous screenshot is associated to skos:note; the property chain is composed by the sole rdf:value, so the reified note in the Resource View is displayed as a single value which is actually the rdf:value of the object of skos:note.
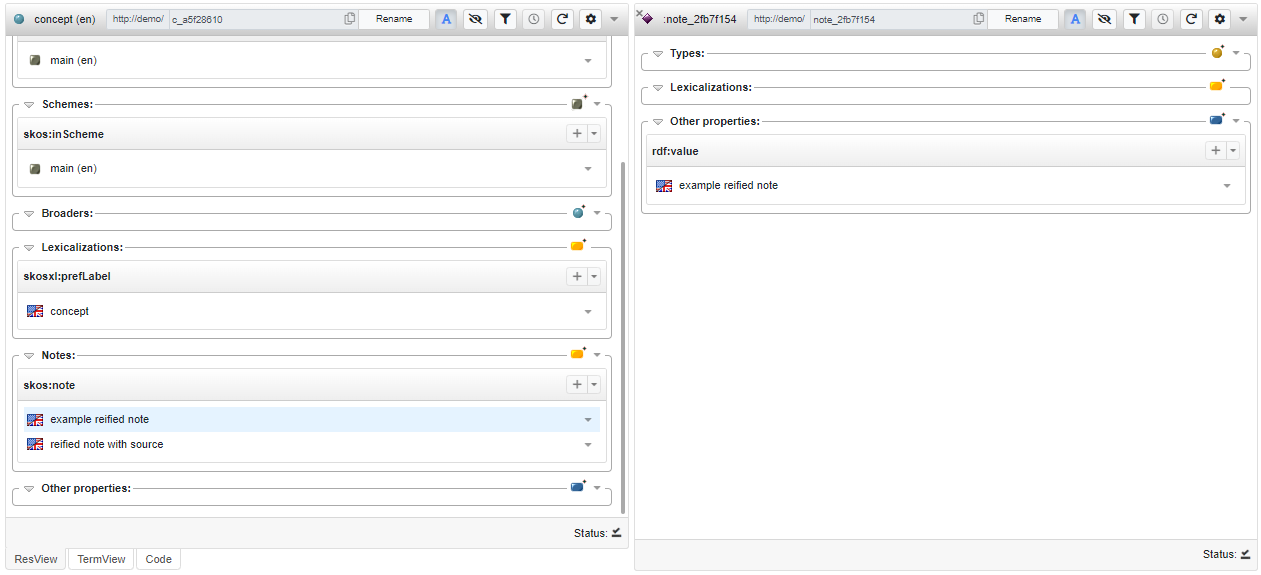
This is just a simple (but actually common) use case, obviously a chain can be composed by multiple properties, in such case the rendered value will be reached through multiple hops (e.g. <resource> <triggering_prop> <object>; <object> <chain_prop1> <res1>; <res1> <chain_prop2> <res2>; ...; <resN-1> <chain_propN> <renderedValue>).
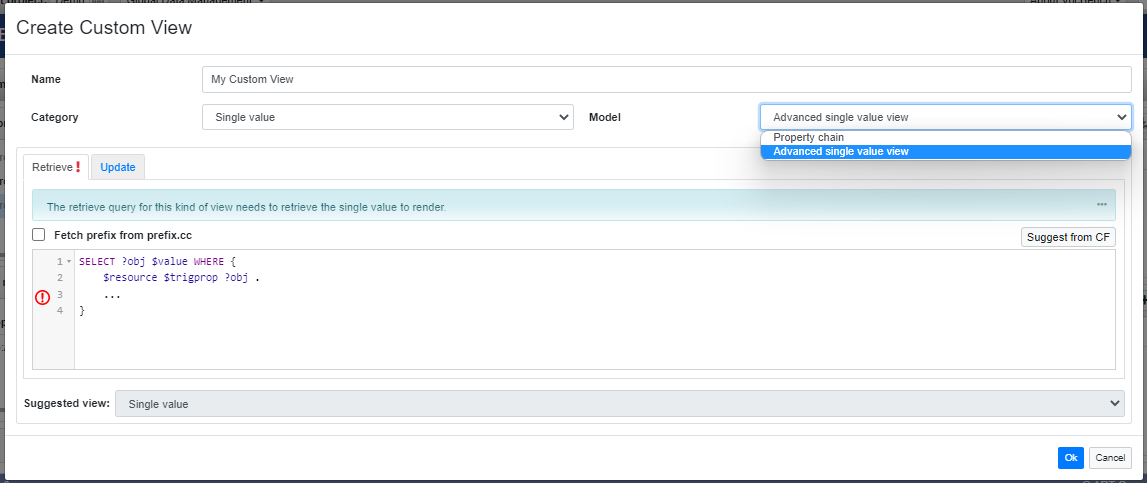
Advanced single value view
This View is more powerful than the previous, in fact it allows you to define any SPARQL query for retrieving the single value to render. This can be done using the SPARQL editor under the Retrieve tab. Such query must meet certain constraints, it must contain the following placeholders:
$value: The value to be rendered, it must be returned as well;$resource: represents the resource being described in ResourceView where the Custom View is shown;$trigprop: represents the predicate that will be associated to the Custom View.
It is also possible to define an arbitrary amount of pivot placeholders (to name $pivot, $pivot_1, $pivot_2, ...) which can be used to define anchor points to be referenced in the Update query.
Each pivot resource returned by the Retrieve query will be bound to the related placeholder in the Update query during an update operation.
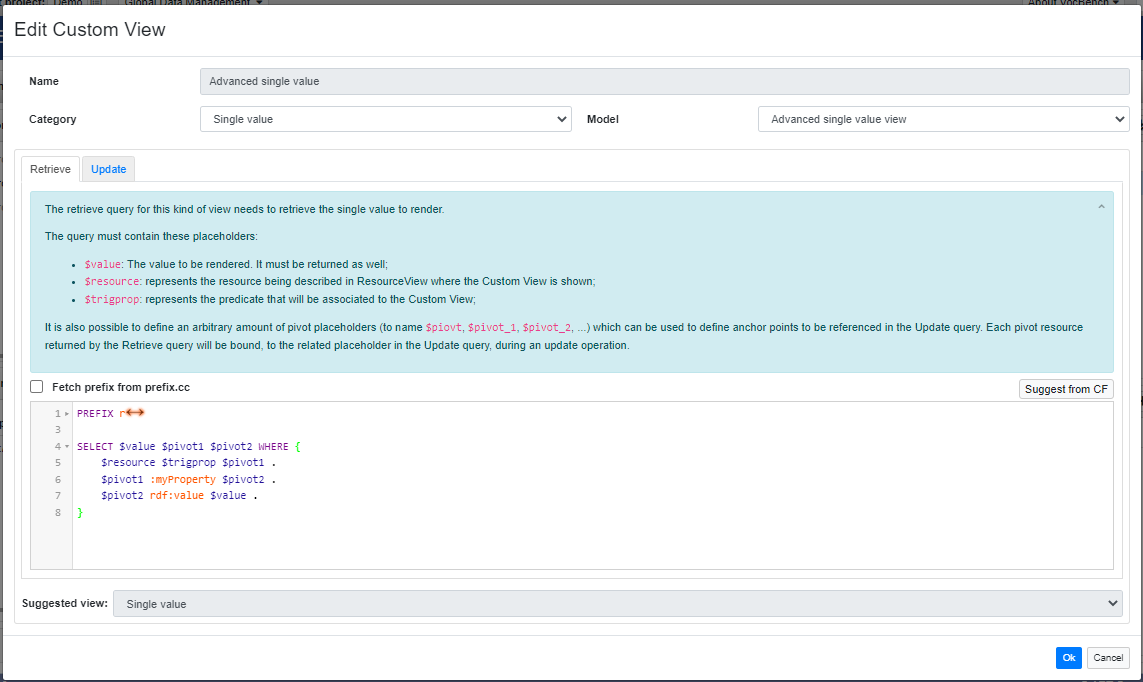
It's noteworthy the Suggest from CF button placed on the right, just above the SPARQL editor which, as the label suggests, given the selection of an existing Custom Form, tries to infer and suggest a suitable SPARQL select for the Custom View.
Switching to the Update tab, this Custom View allows also the customization of the value update. Three Update modes are available:
- No update: the value is not editable;
- Value edit: the value is editable as a string serialized in NT format;
- Value picker: the value is editable by means a value picker. The picker can be then customized for restricting the type of value to:
- Any kind of value;
- Resource, which in turn can be restricted in order to pick only instances of specific class(es);
- Literal, which in turn can be restricted to enter only literals with a specific datatype.
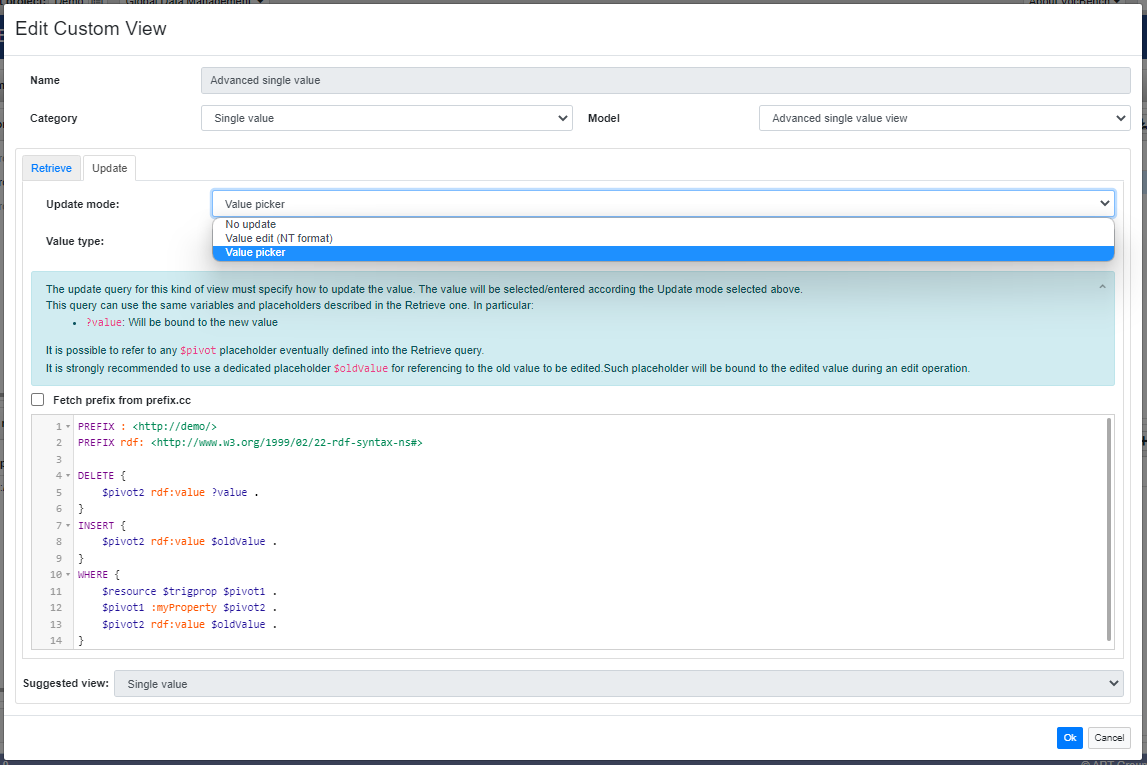
If the update is allowed (2nd or 3rd options above), a SPARQL update must specify how to update the value.
In this query the same variables and placeholders described in the Retrieve one are available. In particular the reserved variable ?value which will be bound to the new value.
It is possible to refer to any $pivot placeholder eventually defined into the Retrieve query.
It is also strongly recommended to use a dedicated placeholder $oldValue for referencing to the old value to be edited. Such placeholder will be bound to the edited value during an update operation.
Vector model views
Vector model views, as suggested by the name, allows you to show a vector of values in place of the actual object of a property. In the ResourceView such values are represented in tabular format where each row represents the description for the object of the triggering property.
Predefined static vector model
The editor for such view is quite similar to the Property chain one, a Headers selector allows the definition of a list of properties.
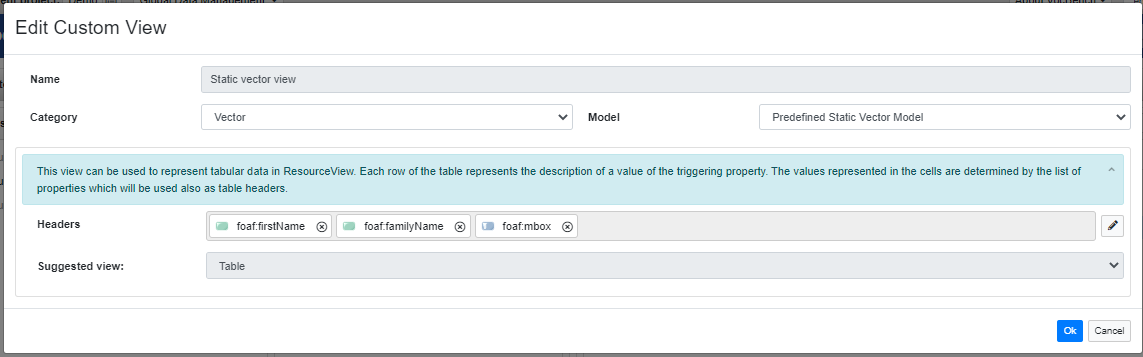
The above Custom View defines a table with three headers: foaf:firstName, foaf:familyName, foaf:mbox.
Now let's consider the following ResourceView, where :ART, instance of foaf:Group, has four foaf:members. By default, :ART would be rendered as follows.
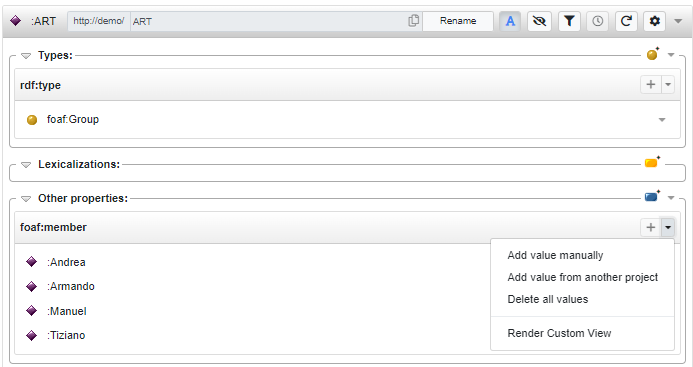
As you can see, under the foaf:member section of the ResourceView the objects are rendered through their qname. If we associate the above CustomView to foaf:member, the same members are now replaced by a table where each row contains the foaf:firstName, foaf:familyName, foaf:mbox of the member.
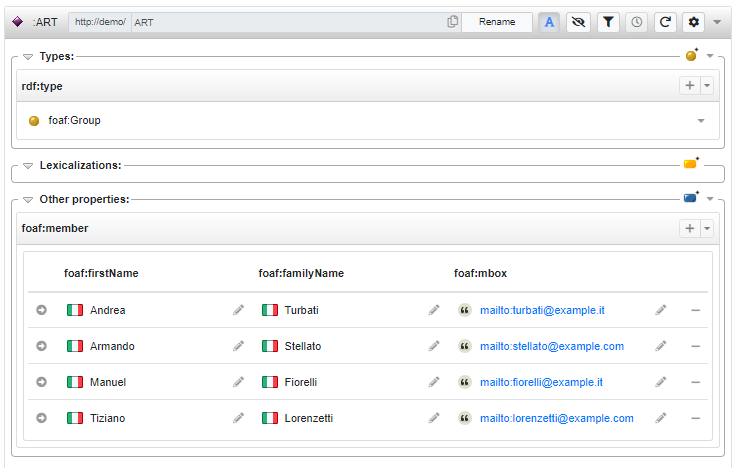
At the left of each table row, a button allows user to open the ResourceView of the actual resource (e.g. :Andrea, :Armando, ...). A field can be edited by clicking on the pencil button and, in case it is in turn a resource, a double click on it opens the related ResourceView. Finally, the - button on the right removes the whole table row (object of the triggering property).
Dynamic customizable vector model
The Dynamic customizable vector model is an additional view for representing data in tabular format. Unlike the previous one, the table field are determined through a SPARQL query.
In the Retrieve tab you can define a query with an arbitrary amount of ?field_value variables (e.g. ?name_value, ?family_name_value, ...) which identify the value that will be rendered in the table fields. The table headers will be labeled after these identifiers by just removing the suffix _value (e.g. ?name_value -> name, ?family_name_value -> family_name).
The Retrieve query must meet some constraints already seen in the Advanced single value view, in particular: it must returns the fields variables and the variable representing the object of the $resource $trigprop pair (e.g. ?obj in $resource $trigprop ?obj).
It must also contains the placeholders $resource, which represents the resource being described in ResourceView, and $trigprop which is the predicate that will be bound to the property associated to the Custom View.
It is also possible to define an arbitrary amount of pivot placeholders (to name $pivot, $pivot_1, $pivot_2, ...) which can be used to define anchor points to be referenced in the Update query.
Each pivot resource returned by the Retrieve query will be bound, to the related placeholder in the Update query, during an update operation.
As per the Advanced single value view, a Suggest from CF allows to infer a Retrieve query starting from an existing Custom Form.
Now, let's consider the same use case seen for the Predefined static vector model. We can obtain a similar result with the following Custom View.
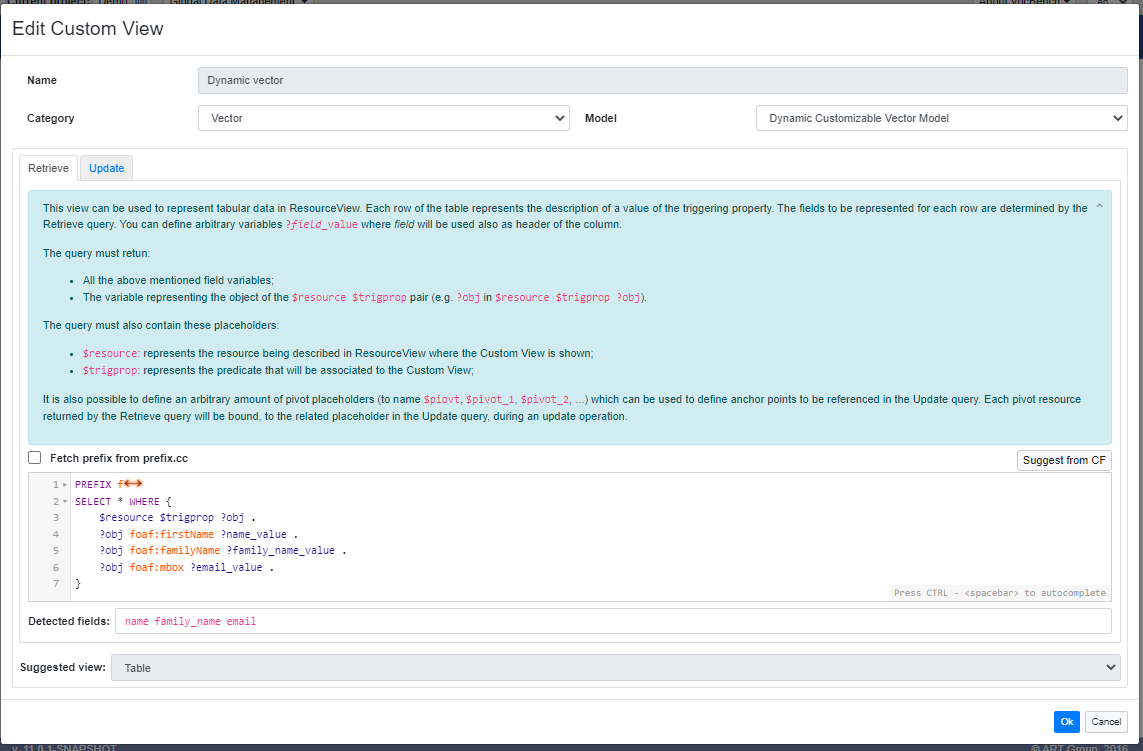
As you can see, there are three field variables: ?name_value, ?family_name_value and ?email_value which are the object respectively of foaf:firstName, foaf:familyName and foaf:mbox.
Just below the SPARQL editor are shown the fields automatically detected in the query (in this case name, family_name and email) which will be used also as table columns' name. Moving to the Update tab, for every detected field, we have the possibility to customize the update behaviour of the related values.
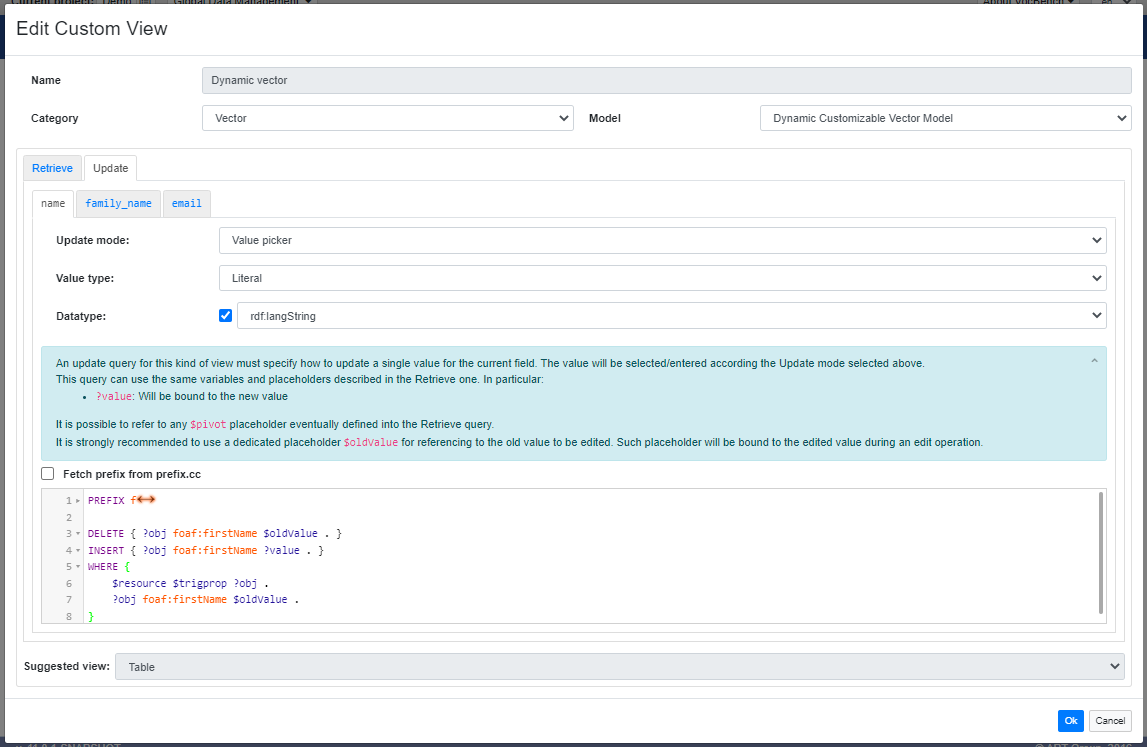
The available update modes are the same already described for the Advanced single value view (No update, Value edit and Value picker) with the possibility to specify the SPARQL update to execute.
The table resulting from the association of this Custom View with the foaf:member property is the following.
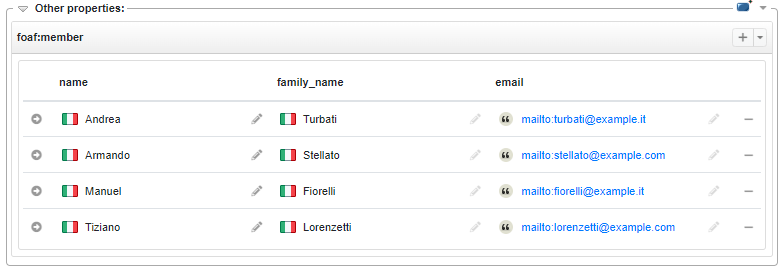
Being applied on the same data, it is obviously quite similar to the one obtained with the previous Custom View, just notice that the table headers are named after the field variables, and the fields under family_name and email columns are not editable (pencil button not clickable and greyed out) since the update mode has been set to No update.
Note: for the sake of simplicity, the Dynamic customizable vector model has been described using the same example of the Predefined static vector model. However, for such simple use case, it could be excessive to use this Custom View, it would be much simpler to use the predefined static one (unless user wants to customize the update mode as we just saw). Dynamic customizable vector model has been designed for more complicated use cases, where the Retrieve SPARQL query might need more complex patterns for reaching the field values.
Geospatial views
Geospatial views are useful for representing geospatial data like points, areas and routes on maps. The map widget has been implemented using the open-source JavaScript library Leaflet.
Point
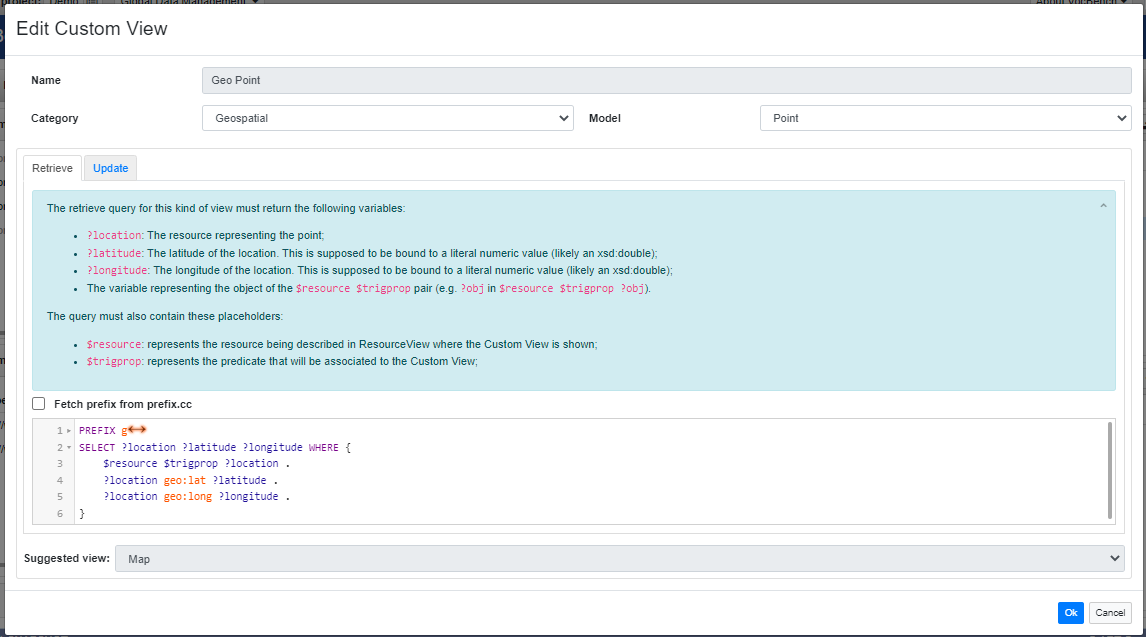
Point is the simplest view for the geospatial category. As well as all the views under this category, it is SPARQL-based, namely it requires a SPARQL query to specify how to retrieve the data (latitude and longitude of the location) for drawing the point on the map.
The Retrieve query for this view have some reserved variables that need to be returned:
?location:the resource representing the point;?latitude:the latitude of the location. This is supposed to be bound to a literal numeric value (likely xsd:double);?longitude:the longitude of the location. This is supposed to be bound to a literal numeric value (likely xsd:double);
The query must always return the object variable of the $resource $trigprop pair (e.g. ?obj in $resource $trigprop ?obj).
Moreover it must contain the following placeholders:
$resource: represents the resource being described in ResourceView where the Custom View is shown;$trigprop: represents the predicate that will be associated to the Custom View.
Here it is an example of Point view which uses the properties geo:lat and geo:long of the WGS84 vocabulary.
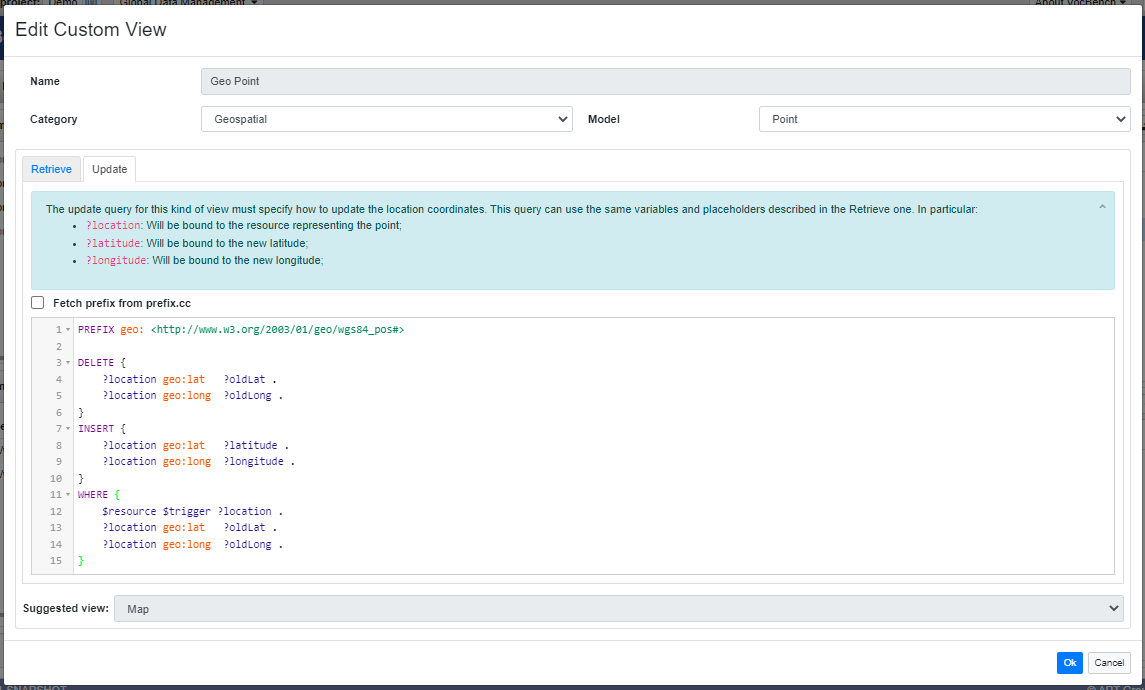
Also in this view, as already seen for other views, there is the possibility to specify a SPARQL Update for specify how to update a point. The same reserved variables described in the Retrieve query are supposed to be used here.
The result of the association of the above Custom View to the triggering property geo:location is like the following.
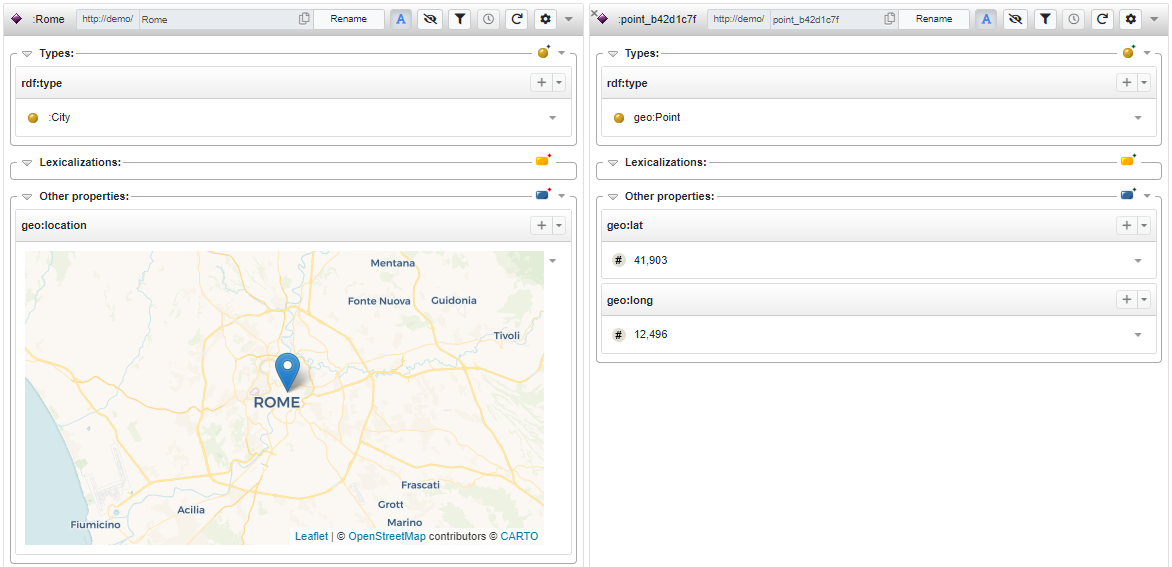
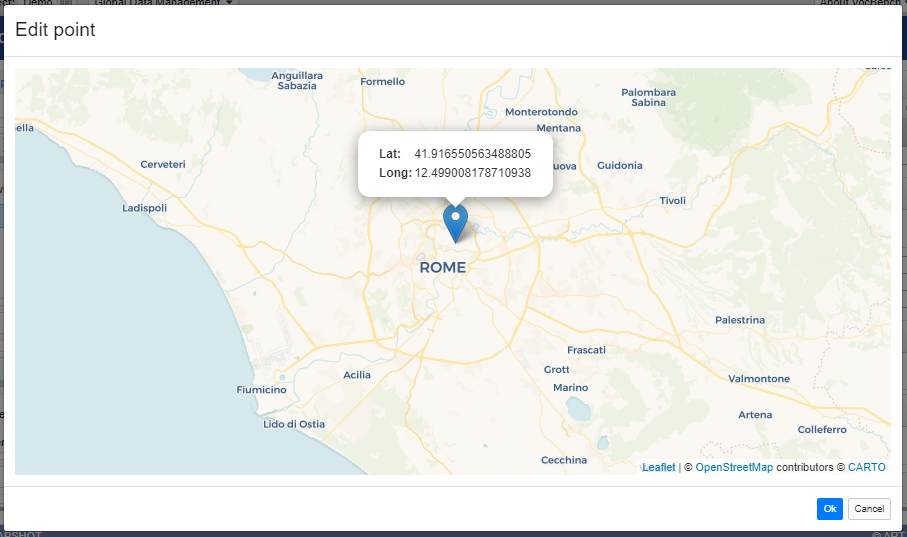
By clicking on the little arrow button on the top-right corner of the map, it is possible to delete and, if the Update query is provided, to edit the point. This last action shows the same map in a dialog where the location can be updated by clicking on a different point.
Area
Area is another SPARQL-based Custom View of the geospatial category. The idea is to represent an area on the map by means multiple points that define its perimeter.
The Retrieve query for this view must return the following variables:
?route_id: The resource representing the route/perimeter of the area;?location: A resource representing a single point of the area perimeter;?latitude:the latitude of the location. This is supposed to be bound to a literal numeric value (e.g xsd:double);?longitude:the longitude of the location. This is supposed to be bound to a literal numeric value (e.g xsd:double);
The query must always return the object variable of the $resource $trigprop pair (e.g. ?obj in $resource $trigprop ?obj).
Moreover it must contain the usual placeholders:
$resource: represents the resource being described in ResourceView where the Custom View is shown;$trigprop: represents the predicate that will be associated to the Custom View.
Let's see an example of usage.
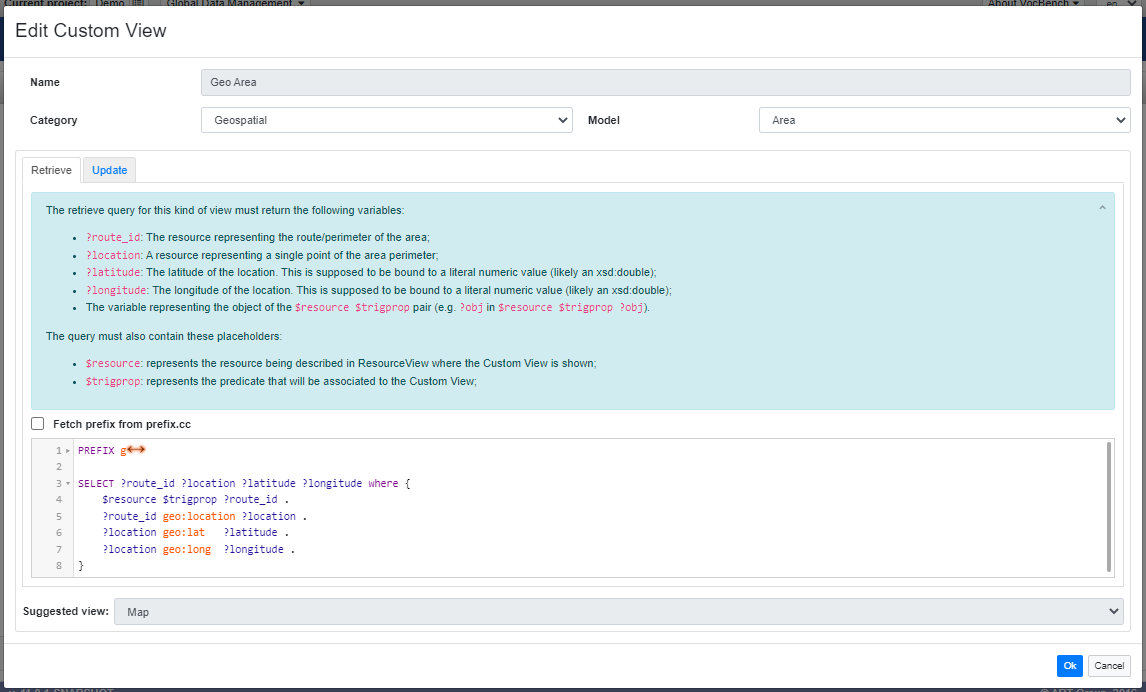
Also in this case the WGS84 vocabulary has been used. So, the triggering property points to a resource which in turns is linked to a set of locations that describe the area polygon, each of them with latitude and longitude.
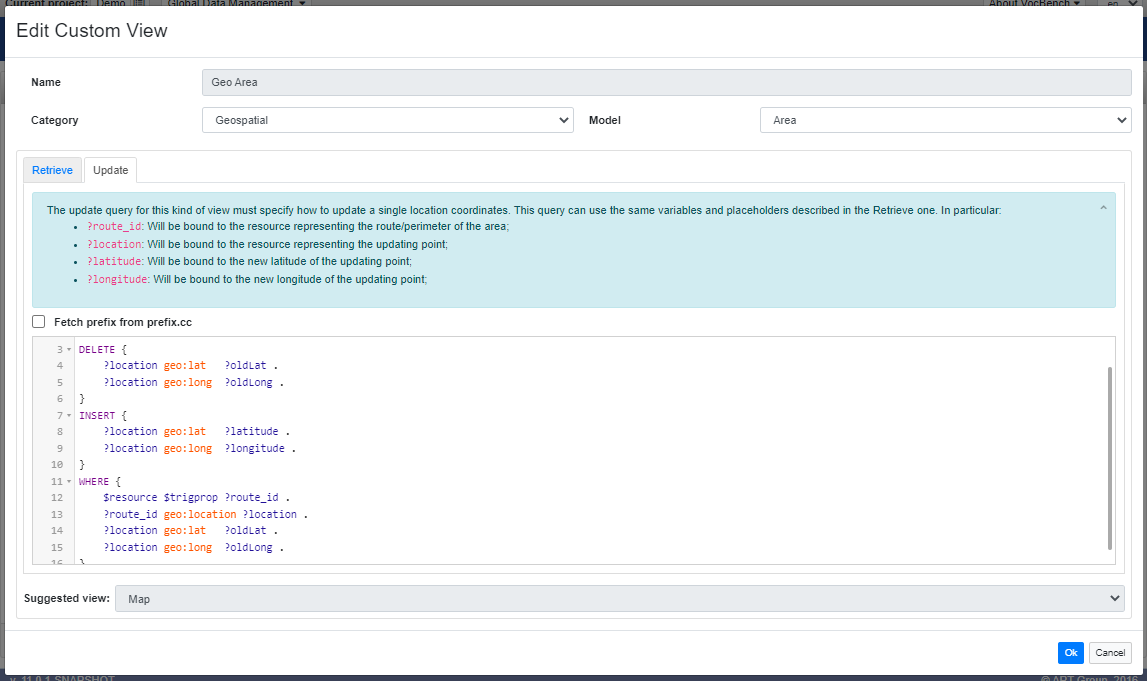
The Update query in this case must specify how to update a single location of the area. Here it is an example: the WHERE block retrieves the coordinates of the updating location (the related resource is bound to the variable ?location), then the DELETE block deletes such old coordinates while the INSERT writes the new ones (new coordinates are always bound to ?latitude and ?longitude).
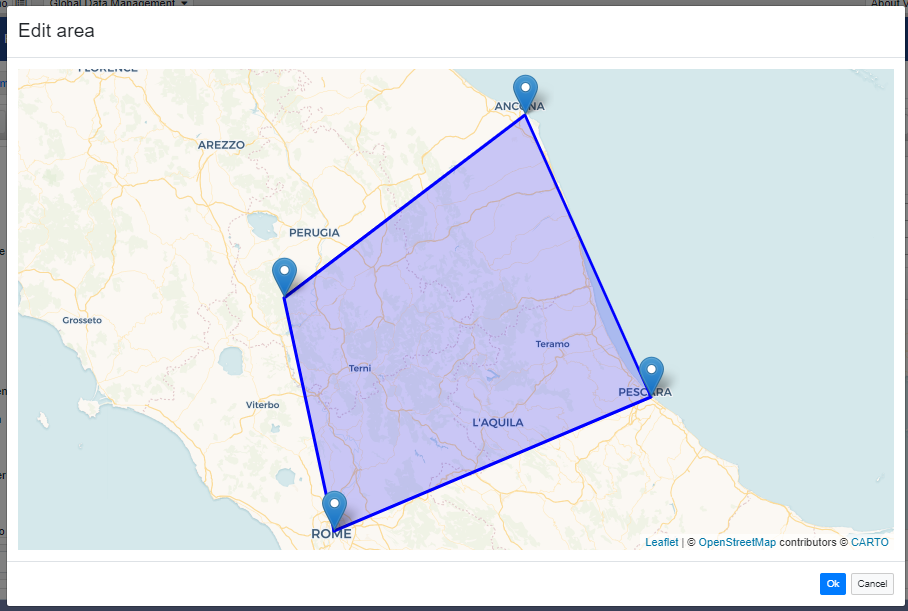
Finally, the Custom View associated to a local :perimeter property gives the following result.
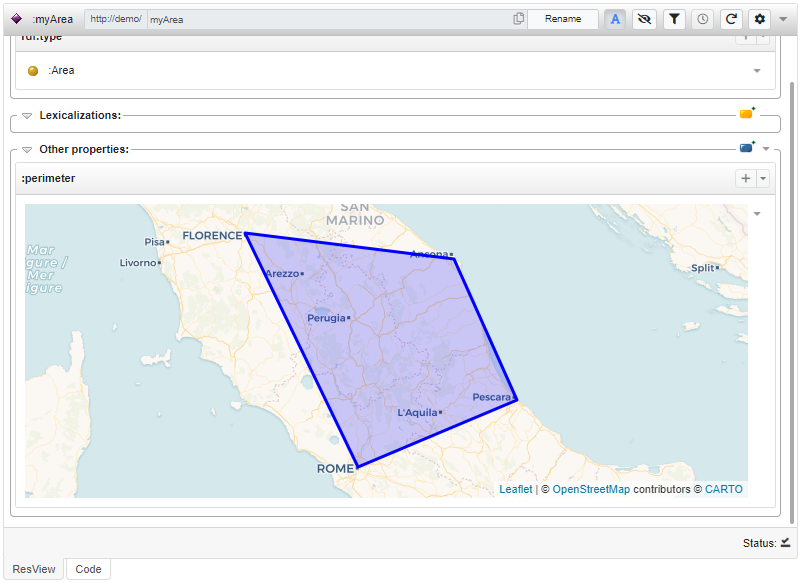
If the Update query is provided, as in this case, the area can be edited through a map opened in a dialog where the points of the perimeter can be dragged in different positions.
Route
The Route view is a variant of the Area view. There is not much more to add, it works at the same way and involves the same variables and placeholders in the query, the only thing that distinguishes it from the Area view is the way the map renders the points. This is an example with the same data (notice the same locations), but a Route view has been used here.
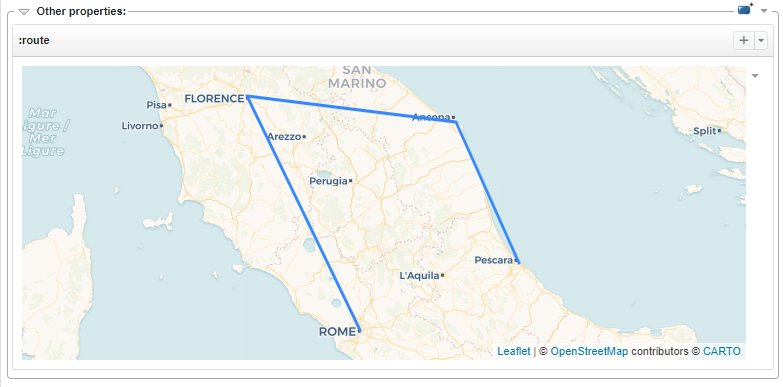
Note: the example showed here, and in the Area view, doesn't take into account the order of the points, this means that it is not granted that the order is maintained (e.g. Rome -> Florence -> Ancona -> Pescara). At such purpose it should have been necessary to use more complex pattern in the Retrieve query which has been avoided here for the sake of simplicity.
Statistical Series views
With the Statistical series views it is possible to show data through charts widgets. Three types of charts are available: bar and pie chart for Series view and line chart for Series Collection view.
Series
This view requires a SPARQL query for retrieving attribute-value mappings defined by name and value. Optional labels for x,y (where supported; e.g. in the bar chart) are included, called series_label and value-label. A single series is identified through the reserved variable series_id.
So, the Retrieve query in this case must return:
?series_id: The resource representing the series;?series_label: (optional) Where admitted, this value is used for identifying the X axis in the chart;?value_label: (optional) Where admitted, this value is used for identifying the Y axis in the chart;?name: Name of a single value;?value: Value to be represented in the chart. This is supposed to be bound to a literal numeric value;
The query must always return the object variable of the $resource $trigprop pair (e.g. ?obj in $resource $trigprop ?obj).
Moreover it must contain the usual placeholders:
$resource: represents the resource being described in ResourceView where the Custom View is shown;$trigprop: represents the predicate that will be associated to the Custom View.
The following is a basic example of Series view.
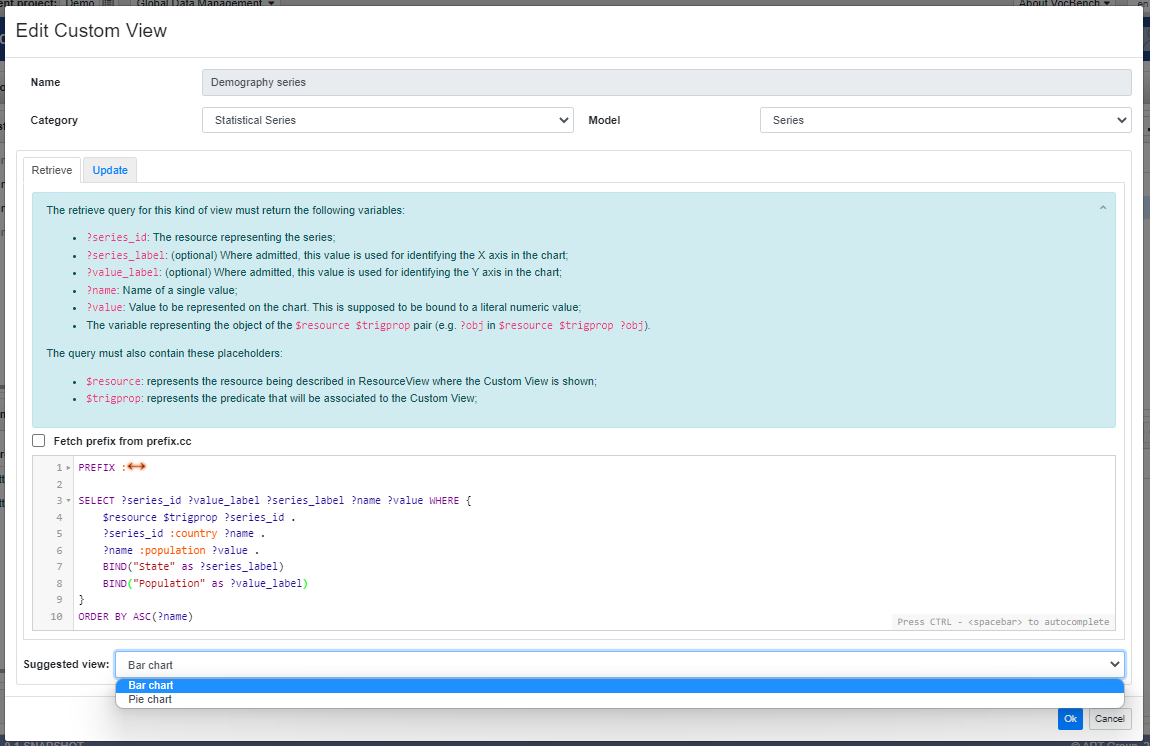
The view retrieves a list of name-value mappings where the name is a resource linked to the series through the :country property and the value is the :population of such country.
As stated for the geospatial views, this example is trivial, for real data use cases it could be necessary to define more complex SPARQL patterns and to use vocabularies suitable for statistical data representation.
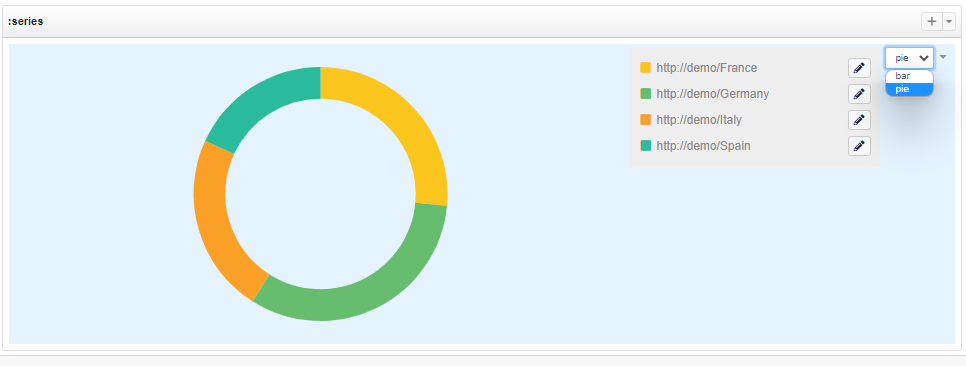
A series is then rendered as in the following image.
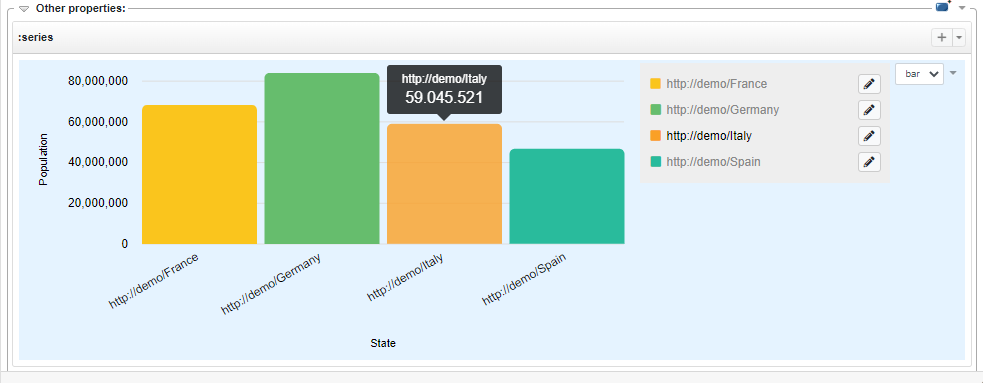
The Custom View is initialized with the bar chart, the one chosen as default view during the creation. On the right of the widget, a selector allows user to choose the alternative available widget, in this case the pie chart.
Also in this Custom View it is possible to specify how to update a single value of the series. The Update query can use the same variables and placeholders described in the Retrieve one. In particular:
?series_id: Will be bound to the resource representing the series;?name: Will be bound to the resource representing the name of the updating value;?value: Will be bound to the new value;
If the update is provided, a pencil button is displayed next to each entry in the legend (which lists the names returned by the retrieve query) which if clicked allows the update of the related value.
Series Collection
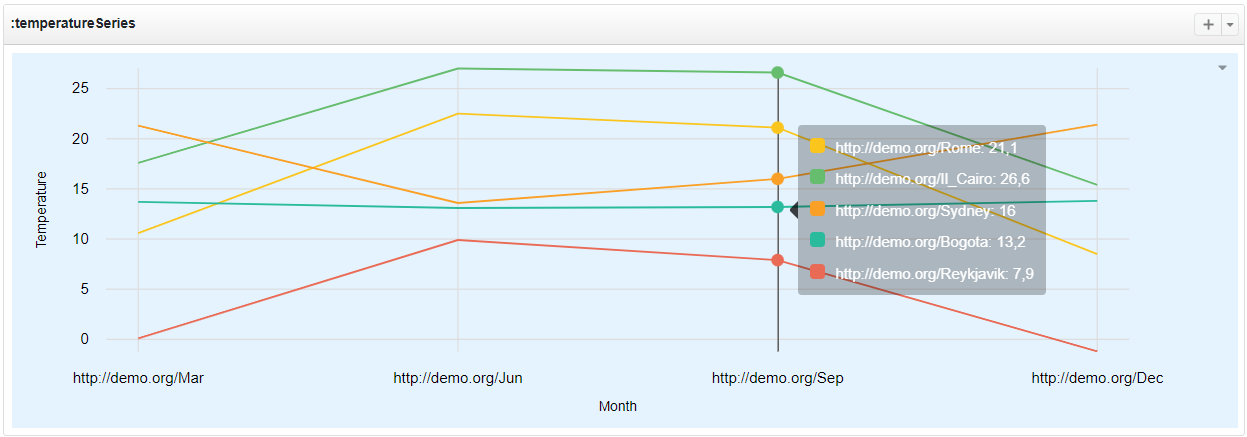
This is another Custom View for statistical data, it allows the visualization of collection of series through a line chart.
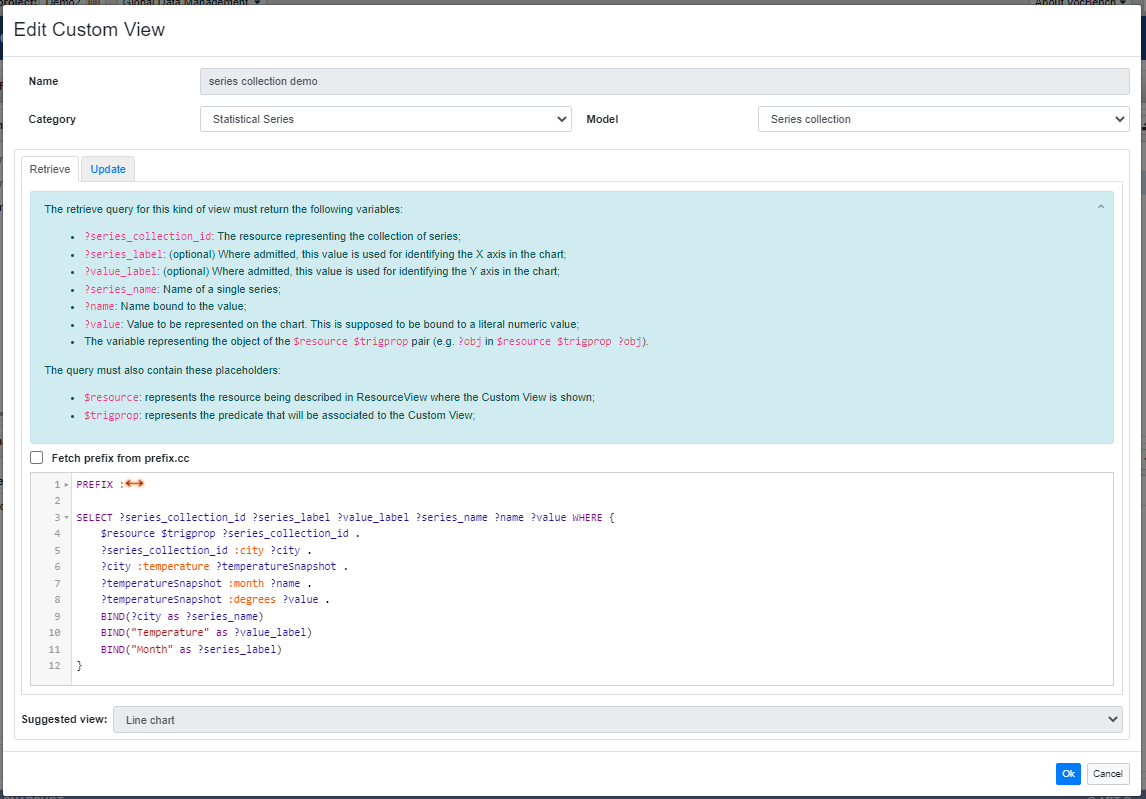
As well as other SPARQL-based view it requires a SPARQL query for retrieving data, specifically it must retrieve series of attribute-value mappings (name and value) where the value is assumed to be a numeric value. Variable series_collection_id identifies a collection of series, each identified by a series_name.
Optional labels for x,y can be provided with the variables series_label and value_label.
Here it is a basic example of Series collection Custom View. In this use case a single series represents the average monthly temperatures of a city.
A resulting line chart is like the follow: the collection is composed by five series, each with four average month - temperatures mappings (name - value).